FLEXPART Retroplumes
Automatically uploaded on 2016-03-05 08:10:02.
| Start time | March 5, 2016, midnight |
| Stop time | March 6, 2016, midnight |
| Duration | 1 day |
| Instrument | FLEXPART Retroplumes |
Related graphs

Graph 1: Receptor layer: 0.5km - 08032016_emiss_THIS96_0.5km.png
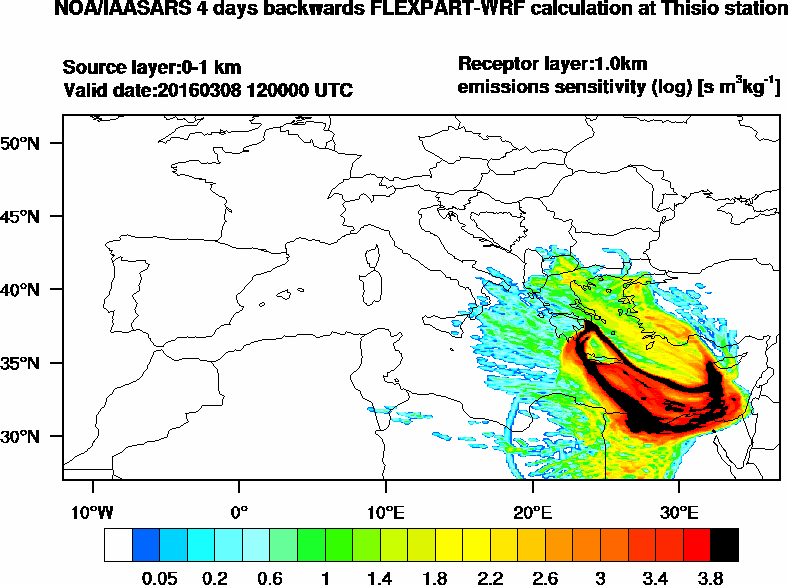
Graph 2: Receptor layer: 1.0km - 08032016_emiss_THIS96_1.0km.png
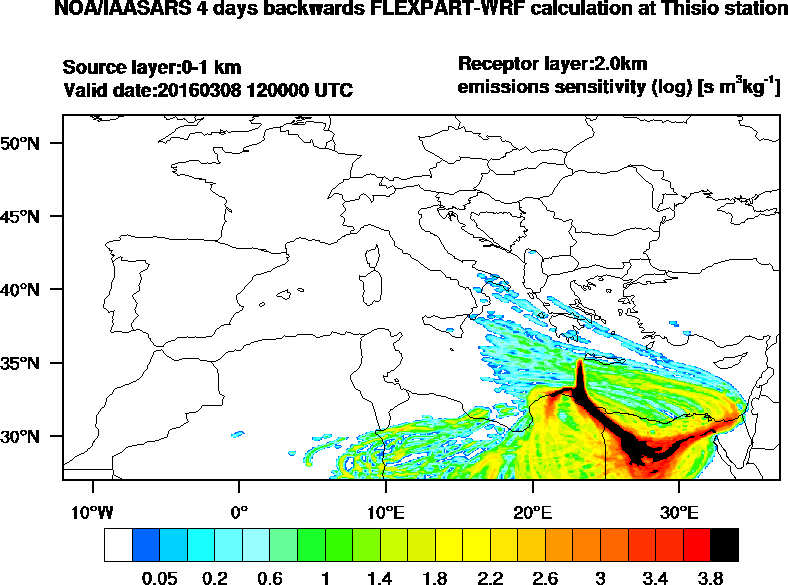
Graph 3: Receptor layer: 2.0km - 08032016_emiss_THIS96_2.0km.png
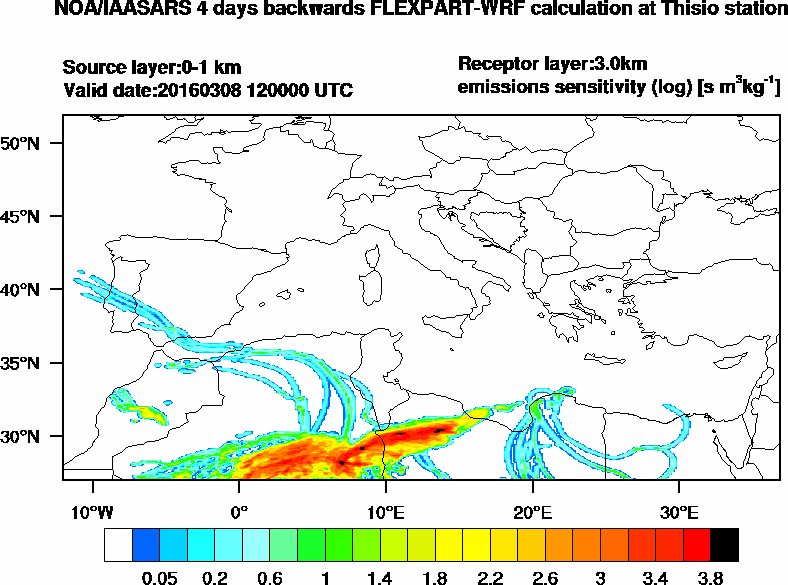
Graph 4: Receptor layer: 3.0km - 08032016_emiss_THIS96_3.0km.png
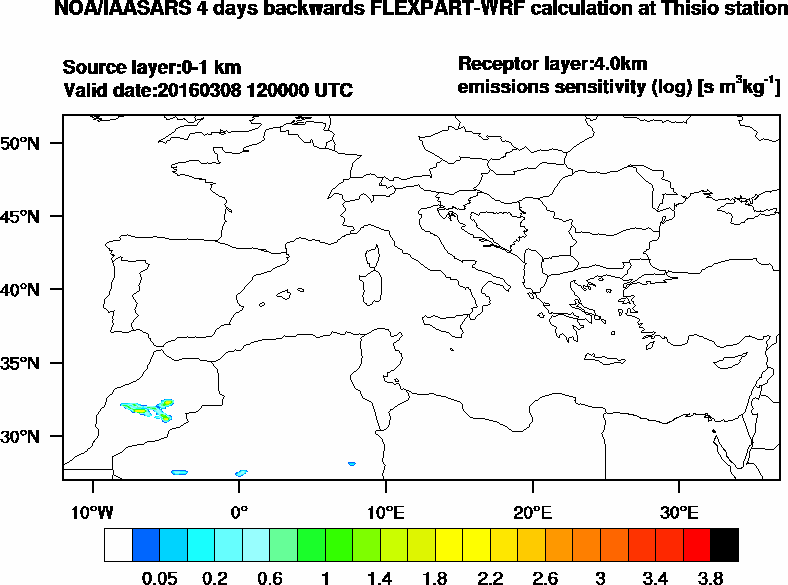
Graph 5: Receptor layer: 4.0km - 08032016_emiss_THIS96_4.0km.png
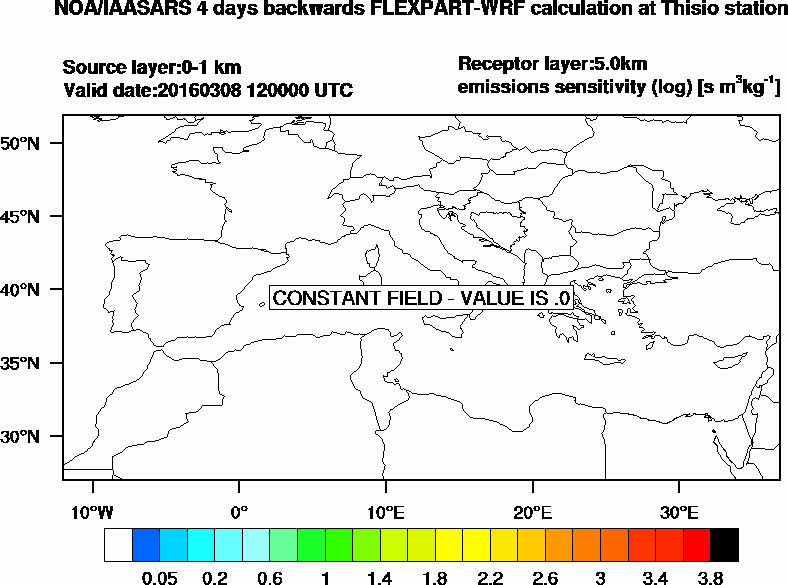
Graph 6: Receptor layer: 5.0km - 08032016_emiss_THIS96_5.0km.png
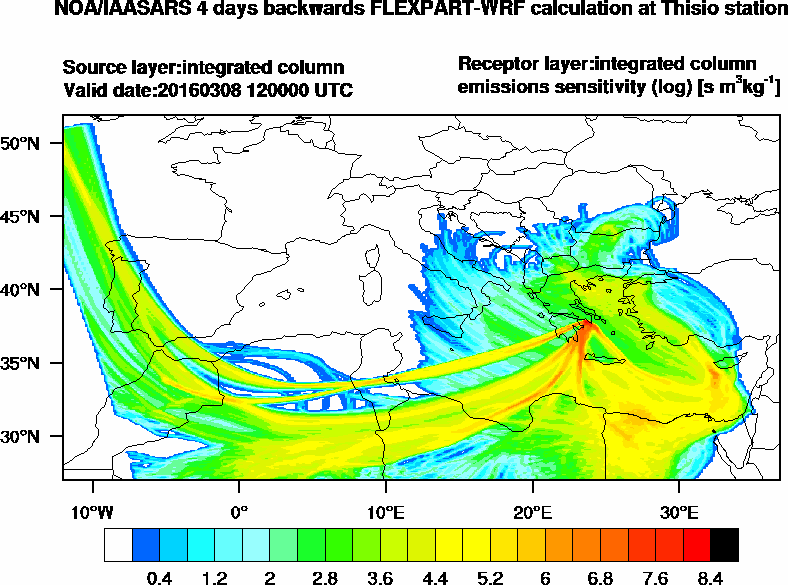
Graph 7: Integrated column - 08032016_emiss_THIS96_integr.png
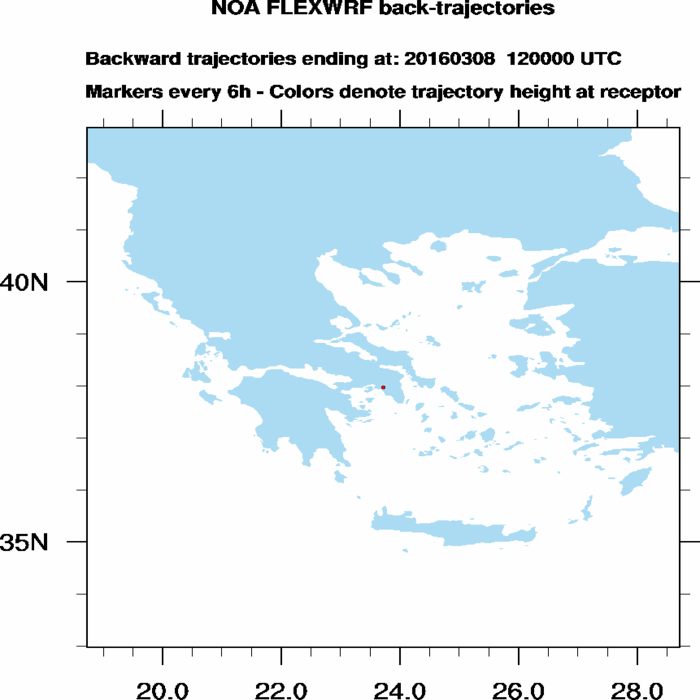
Graph 8: Backward trajectories - 08032016_panel_THIS96.png
Logs & Measurements
FLEXPART Retroplumes logs
No logs found.
Parallel measurements
- PollyXT (Mar 6th, 2016)
- PollyXT (Mar 6th, 2016)
- PollyXT (Mar 5th, 2016)
- PollyXT (Mar 5th, 2016)
- PollyXT (Mar 5th, 2016)
- PollyXT (Mar 5th, 2016)
- NMME-DREAM (Mar 5th, 2016)
- FLEXPART smoke forecast (Mar 5th, 2016)
- PollyXT (Mar 4th, 2016)
- FLEXPART Retroplumes (Mar 4th, 2016)
- FLEXPART smoke forecast (Mar 4th, 2016)
- NMME-DREAM (Mar 4th, 2016)
The campaign is organized and funded through the ACTRIS, the European Research Infrastructure for the observation of Aerosol, Clouds, and Trace gases.