PollyXT
Automatically uploaded on 2016-01-12 18:40:48.
| Start time | Dec. 16, 2015, 6:51 p.m. |
| Stop time | Dec. 17, 2015, 12:51 a.m. |
| Duration | 6 hours |
| Instrument | PollyXT Raman lidar |
Related graphs
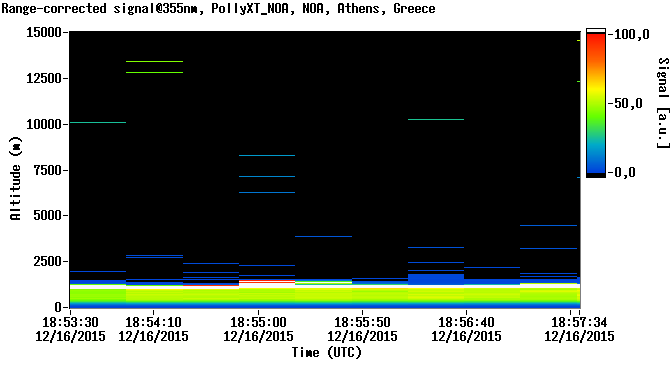
Graph 1: Range-corrected signal@355nm - 2015_12_16_Wed_NOA_18_51_58-355.png
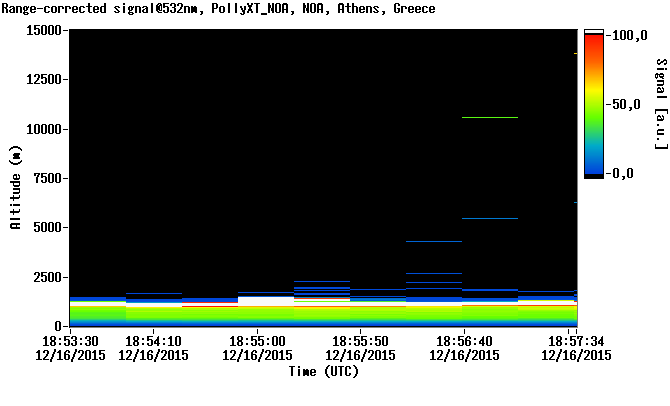
Graph 2: Range-corrected signal@532nm - 2015_12_16_Wed_NOA_18_51_58-532.png
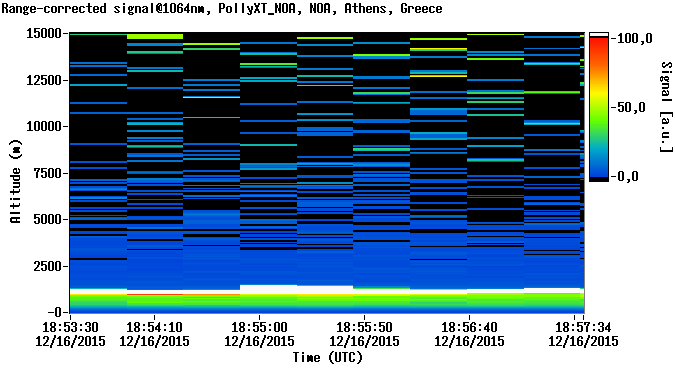
Graph 3: Range-corrected signal@1064nm - 2015_12_16_Wed_NOA_18_51_58-1064.png
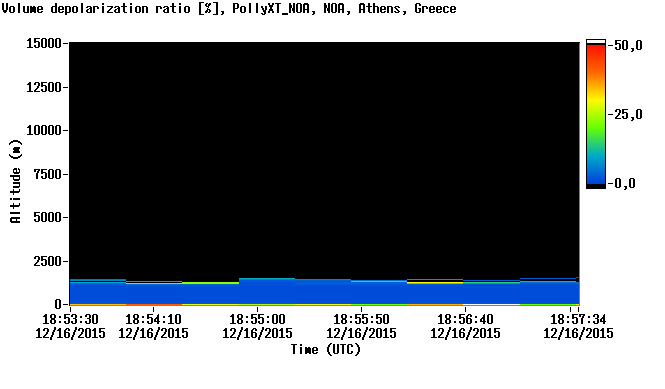
Graph 4: Volume depolarization ratio - 2015_12_16_Wed_NOA_18_51_58-depol.png
Logs & Measurements
PollyXT Raman lidar logs
- Close polly.exe for 7 hours (Dec 16th, 2015)
Parallel measurements
- PollyXT (Dec 17th, 2015)
- PollyXT (Dec 17th, 2015)
- PollyXT (Dec 17th, 2015)
- PollyXT (Dec 17th, 2015)
- PollyXT Overview (Dec 17th, 2015)
- PollyXT (Dec 16th, 2015)
- PollyXT (Dec 16th, 2015)
- PollyXT (Dec 16th, 2015)
- PollyXT (Dec 16th, 2015)
- PollyXT (Dec 16th, 2015)
- PollyXT (Dec 16th, 2015)
- PollyXT (Dec 16th, 2015)
- PollyXT (Dec 16th, 2015)
- CIMEL (Dec 16th, 2015)
- PollyXT Overview (Dec 16th, 2015)
- PollyXT (Dec 15th, 2015)
- PollyXT Overview (Dec 15th, 2015)
The campaign is organized and funded through the ACTRIS, the European Research Infrastructure for the observation of Aerosol, Clouds, and Trace gases.