PollyXT Overview
Automatically uploaded on 2016-01-20 12:50:12.
| Start time | Jan. 17, 2016, midnight |
| Stop time | Jan. 18, 2016, midnight |
| Duration | 1 day |
| Instrument | PollyXT Raman lidar |
Related graphs
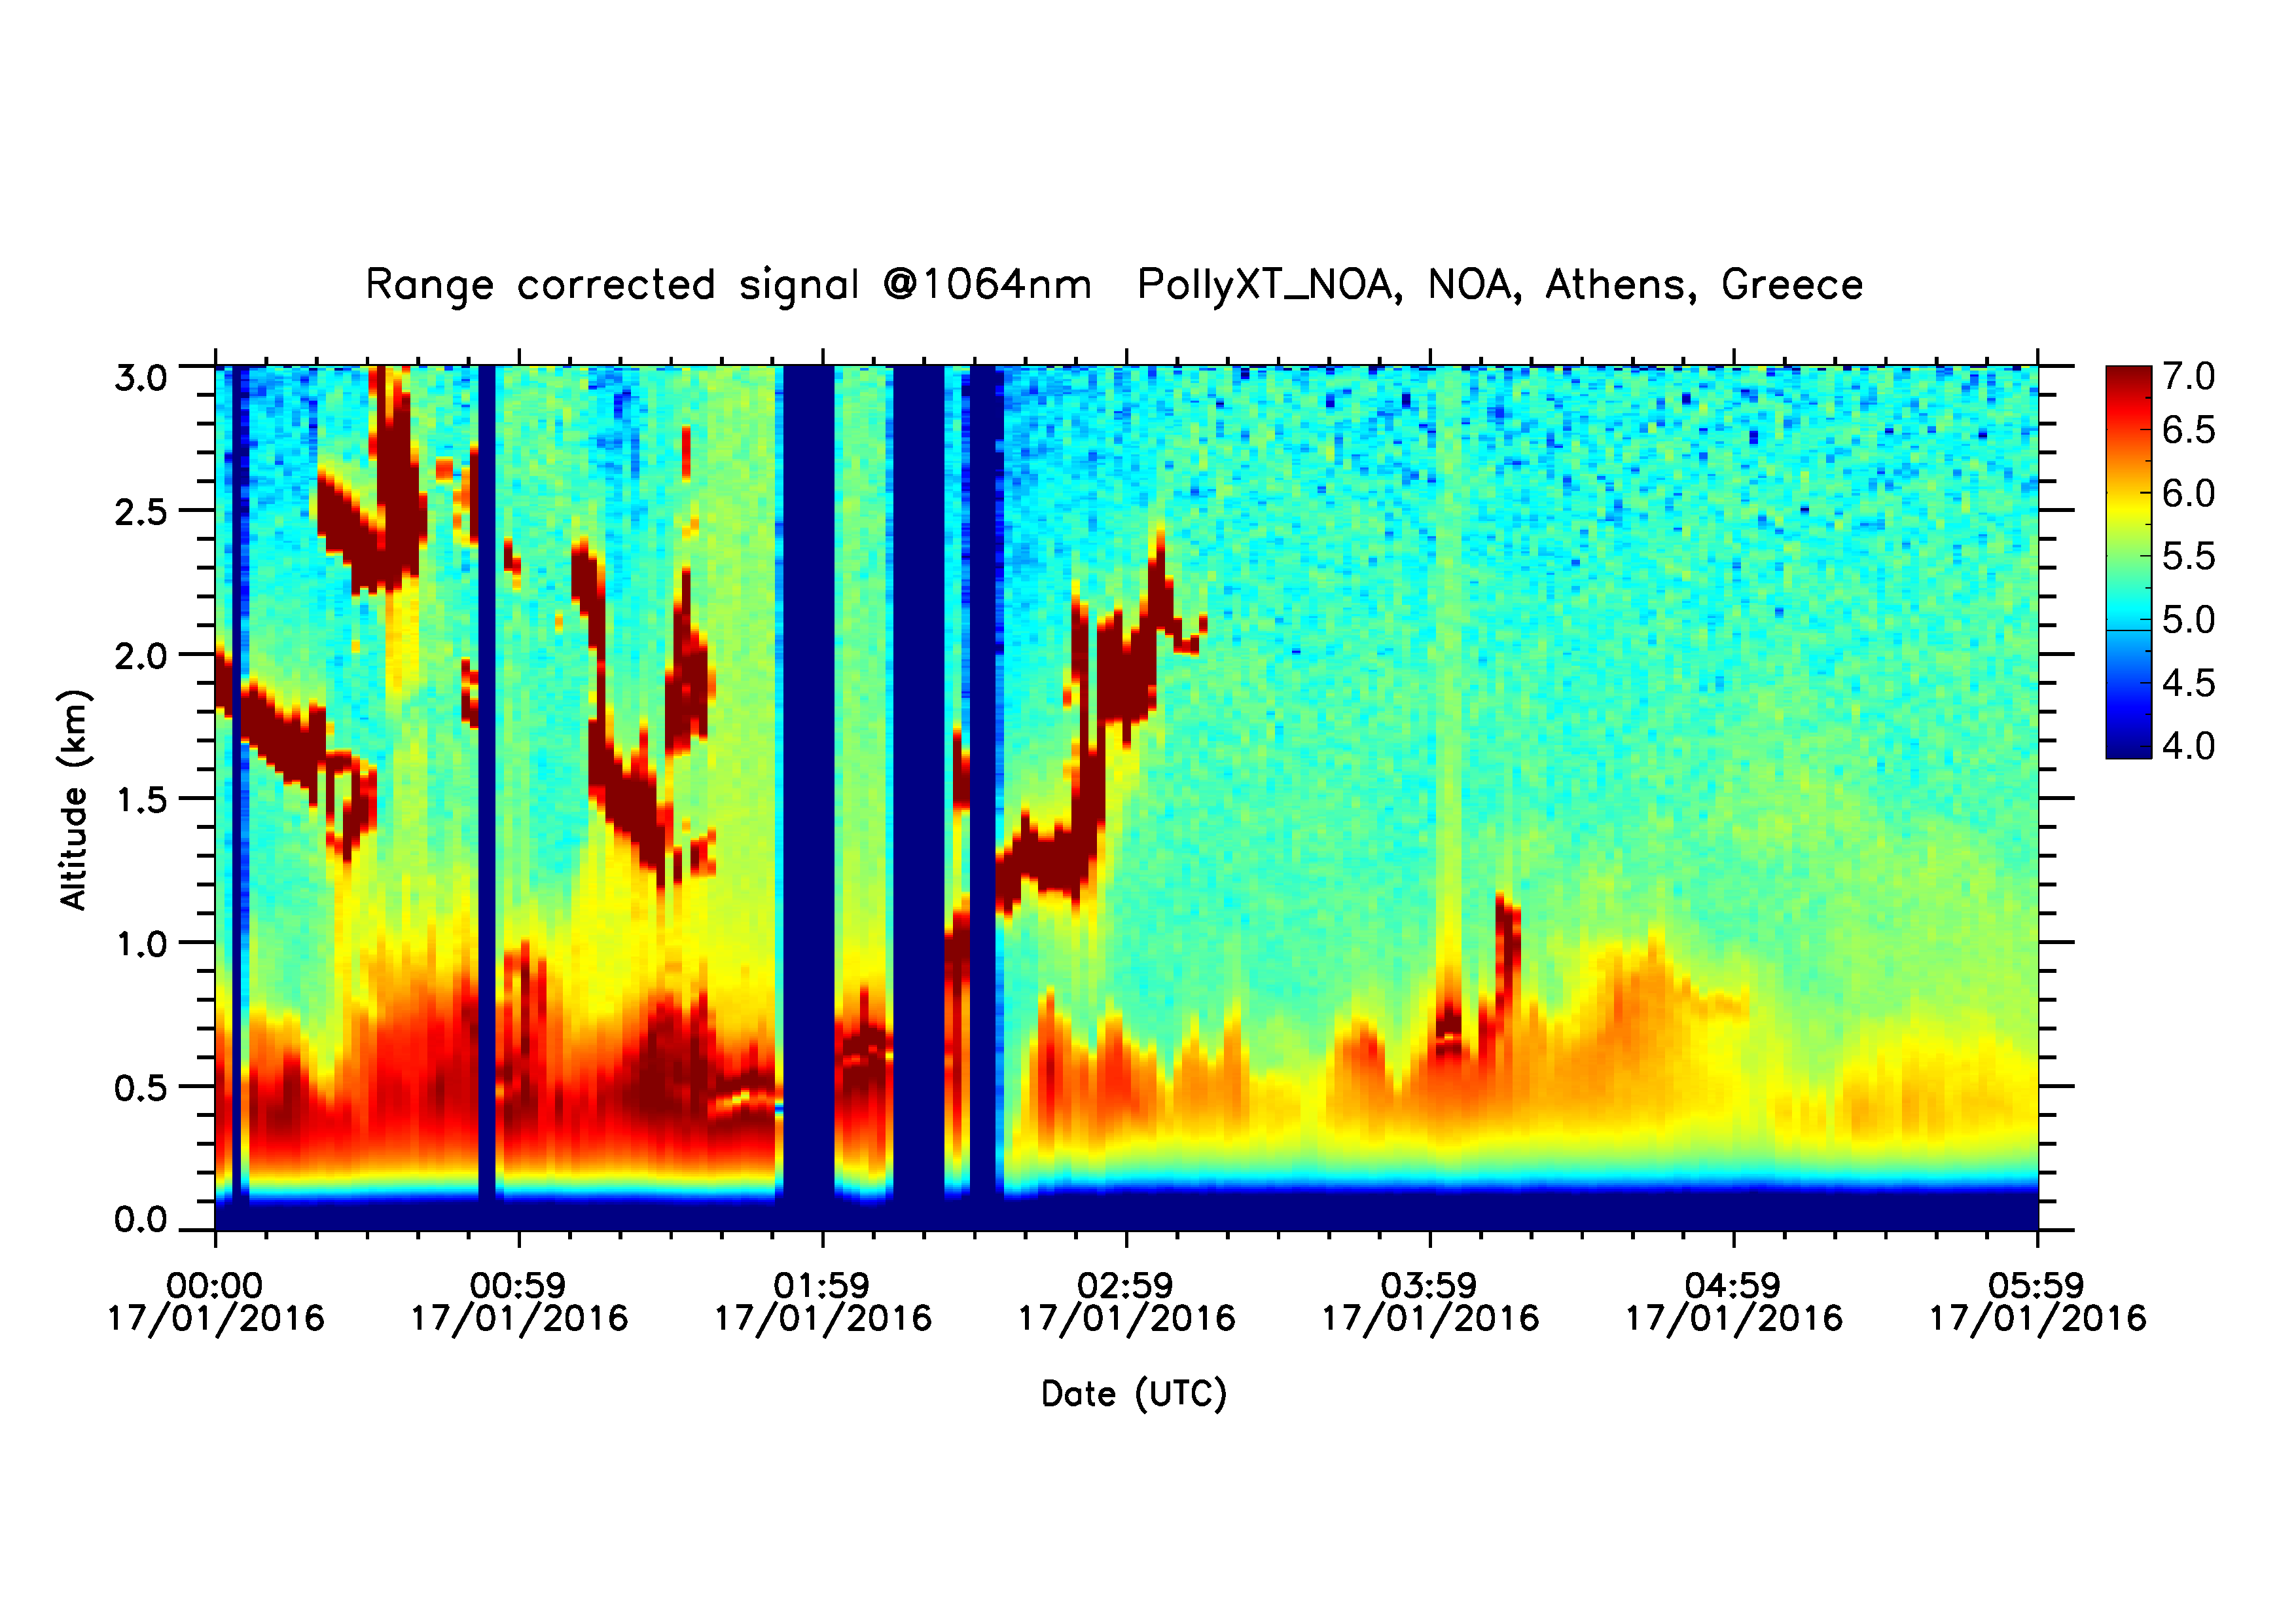
Graph 1: Range-corrected signal @ 1064nm up to 3000m - 00:00 to 05:59
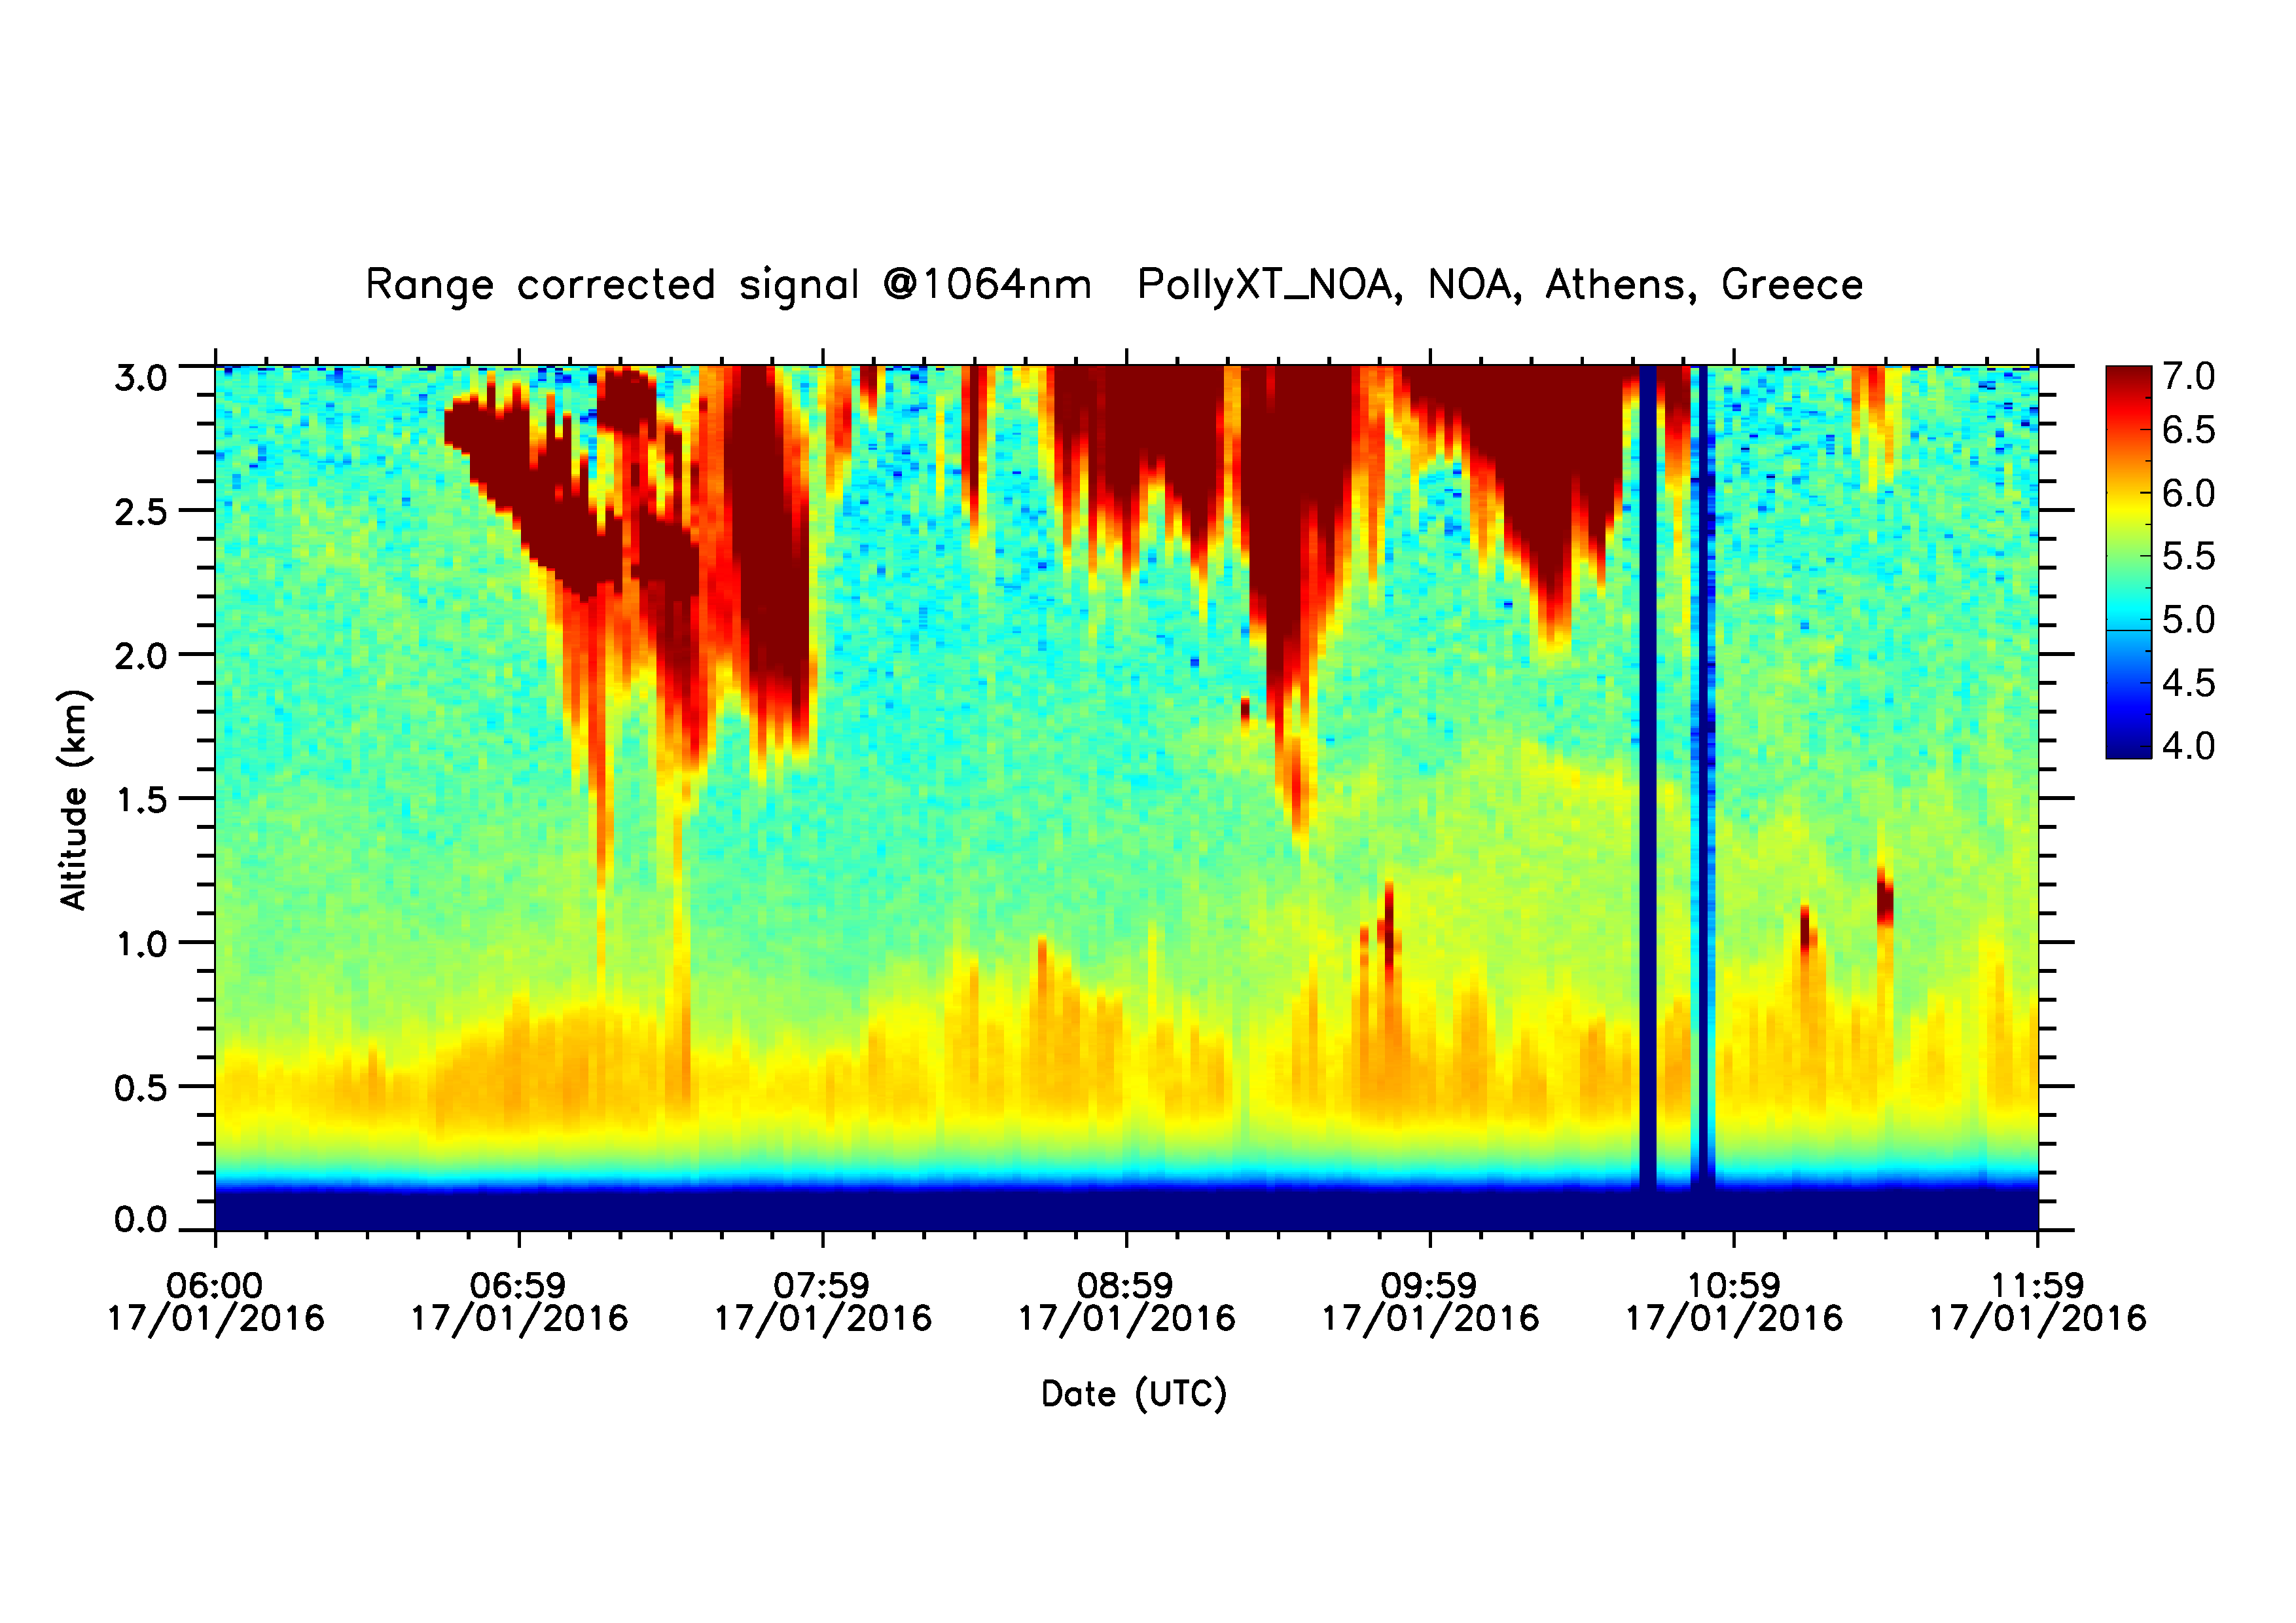
Graph 2: Range-corrected signal @ 1064nm up to 3000m - 06:00 to 11:59
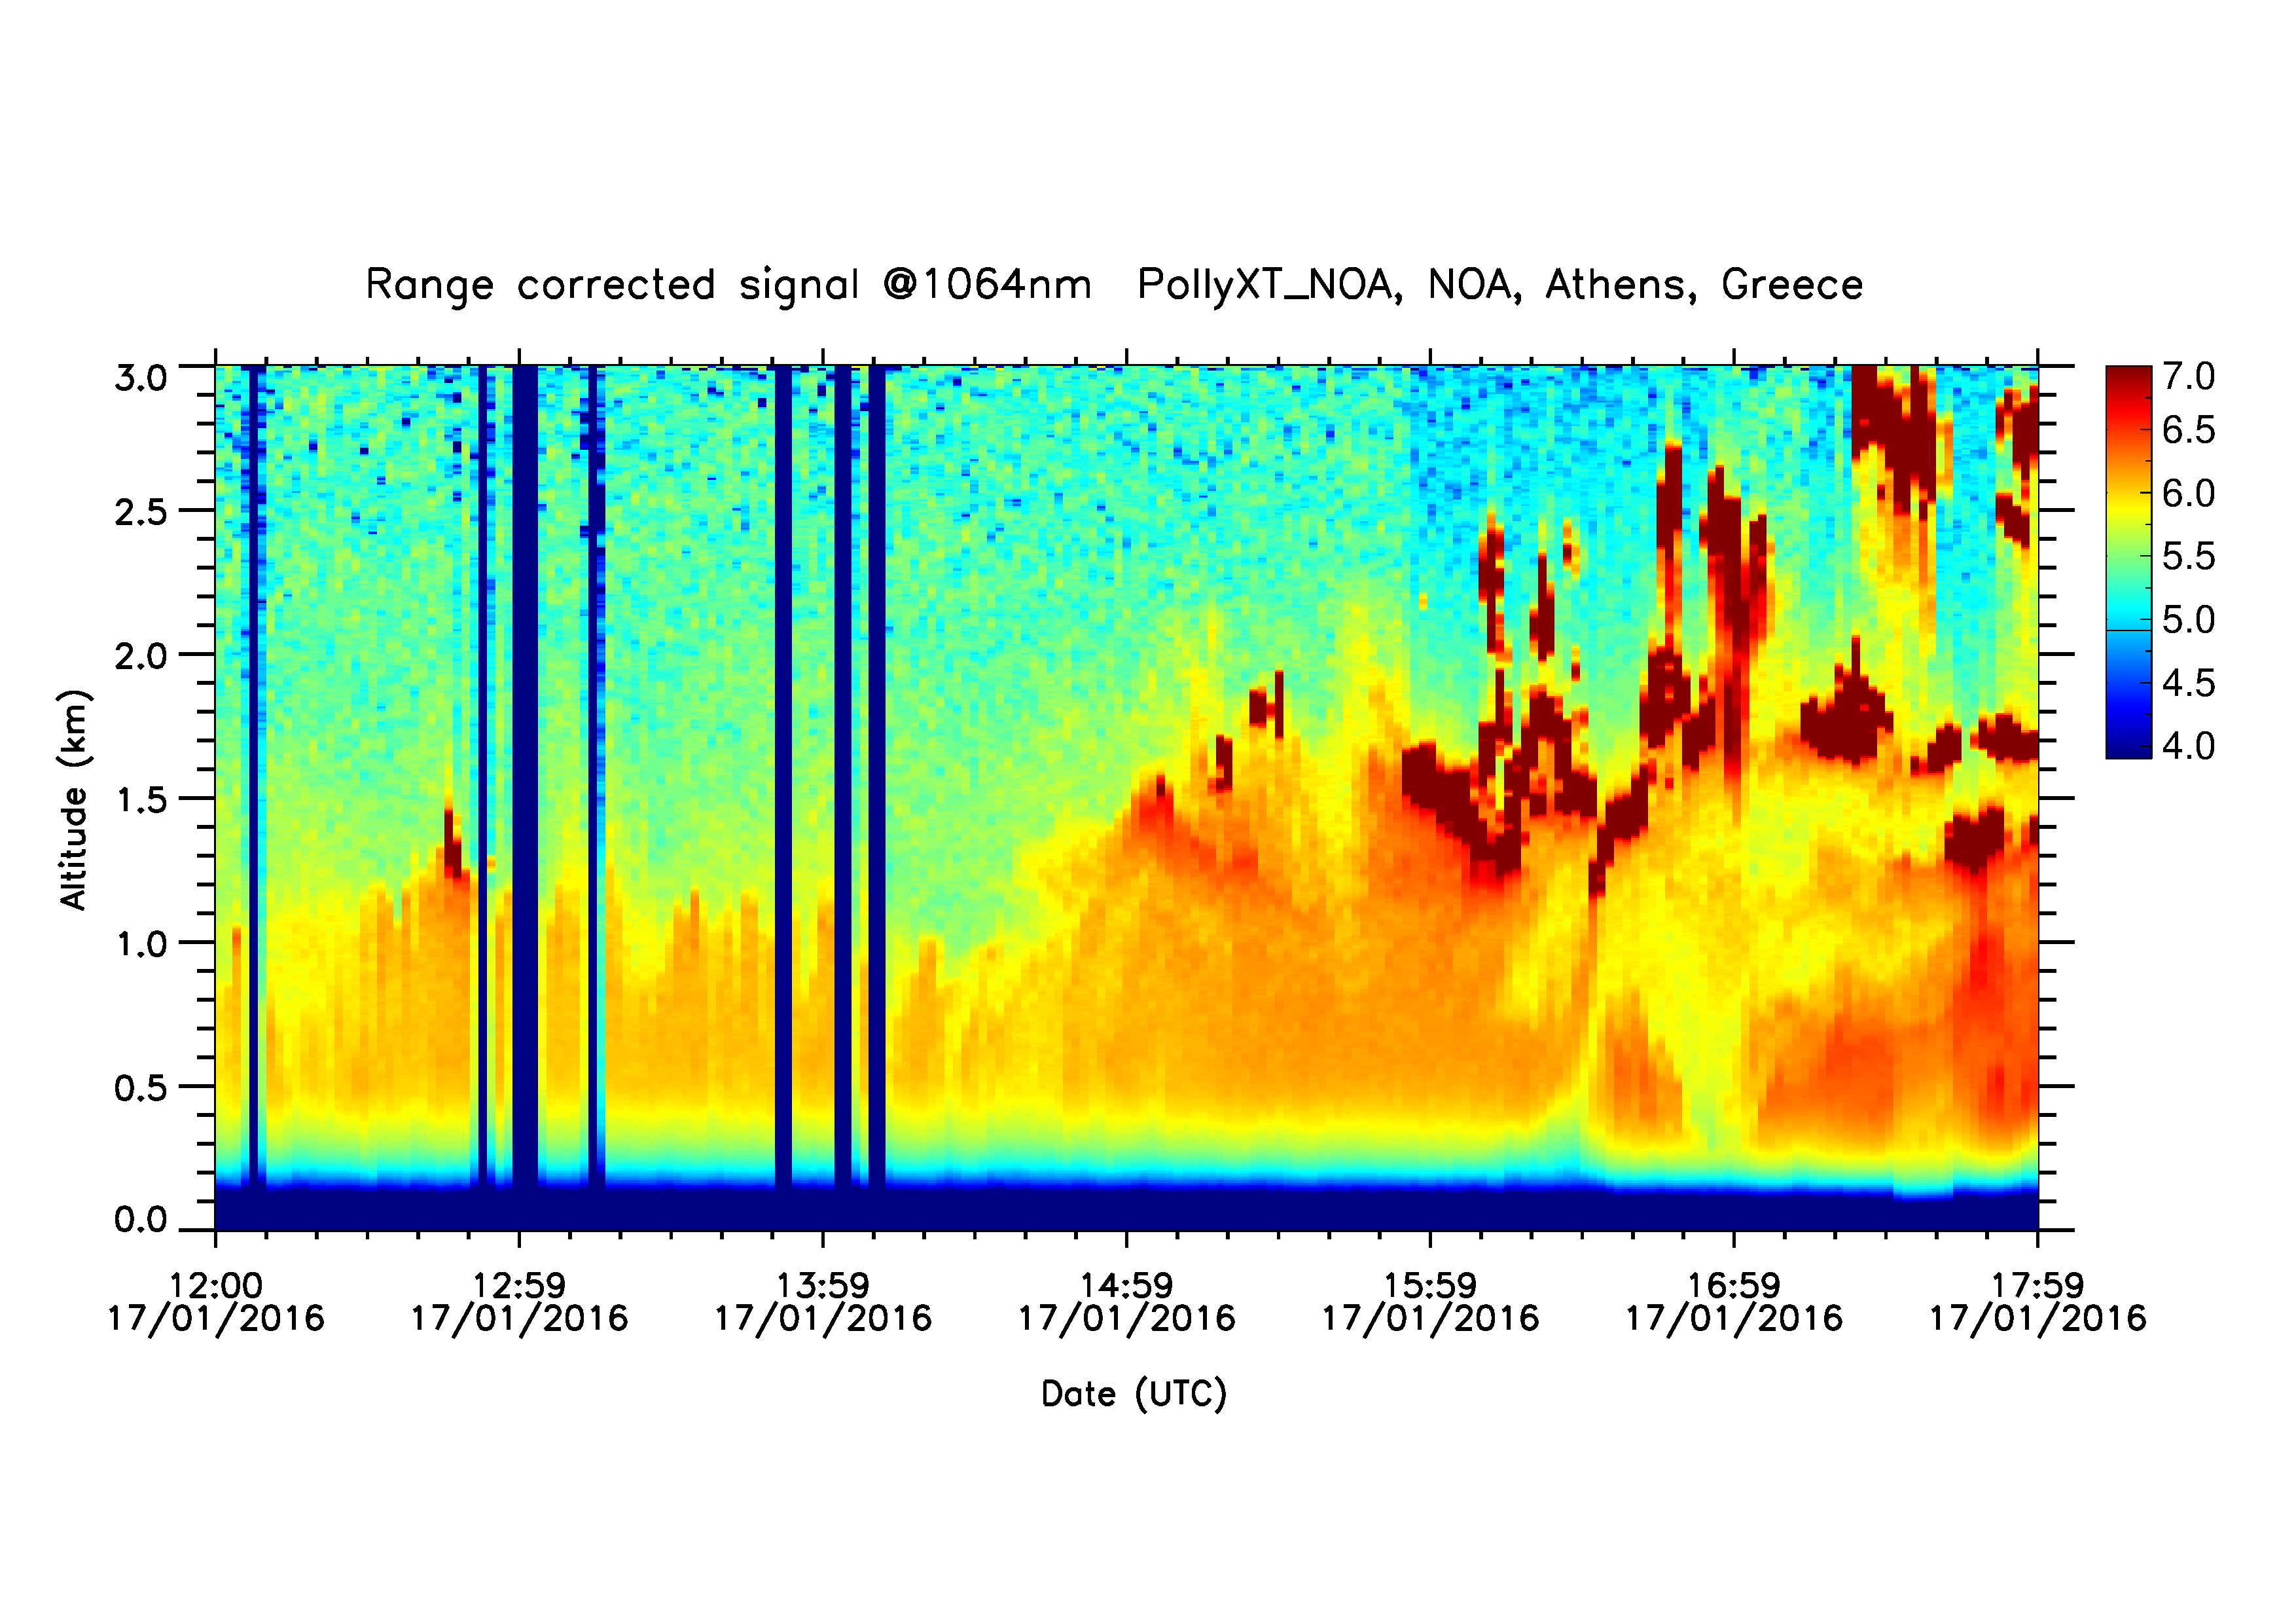
Graph 3: Range-corrected signal @ 1064nm up to 3000m - 12:00 to 17:59
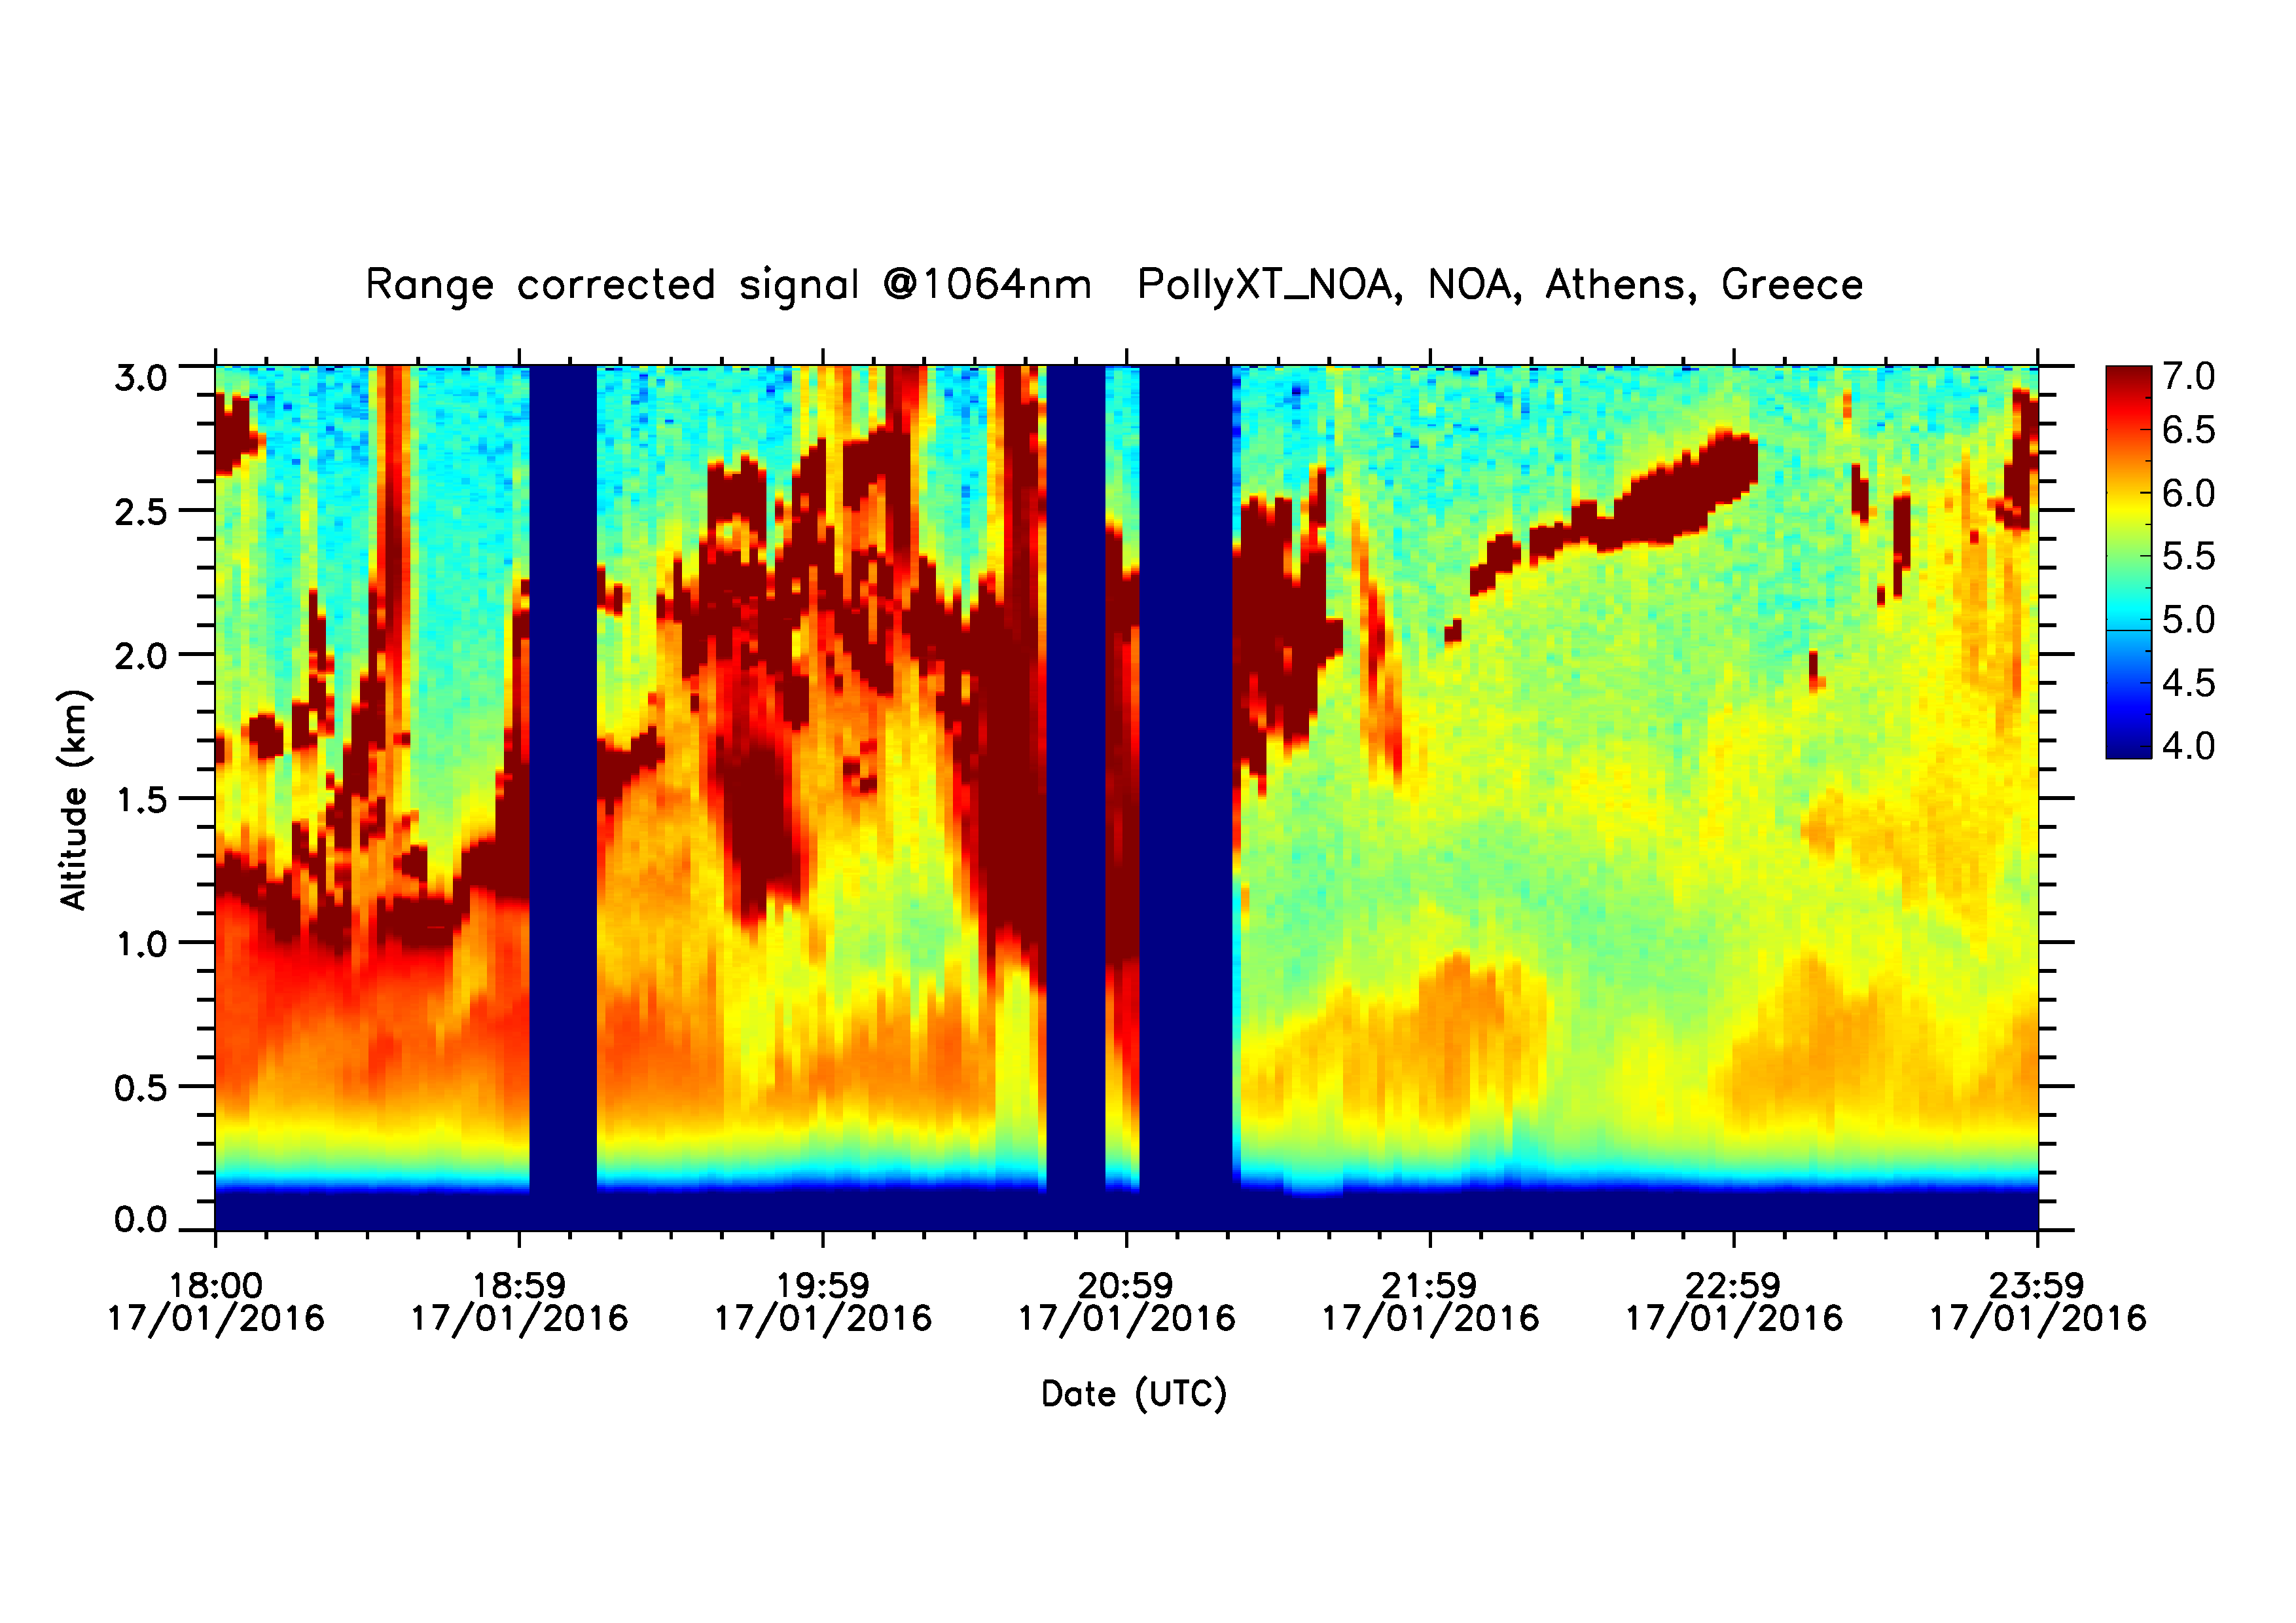
Graph 4: Range-corrected signal @ 1064nm up to 3000m - 18:00 to 23:59
Logs & Measurements
PollyXT Raman lidar logs
- Window cleaning - Heater & AC disabled - No network (Jan 18th, 2016)
Parallel measurements
- PollyXT (Jan 18th, 2016)
- PollyXT (Jan 18th, 2016)
- PollyXT (Jan 18th, 2016)
- PollyXT (Jan 18th, 2016)
- PollyXT (Jan 18th, 2016)
- NMME-DREAM (Jan 18th, 2016)
- FLEXPART smoke forecast (Jan 18th, 2016)
- FLEXPART Retroplumes (Jan 18th, 2016)
- PollyXT Overview (Jan 18th, 2016)
- PollyXT (Jan 17th, 2016)
- PollyXT (Jan 17th, 2016)
- PollyXT (Jan 17th, 2016)
- PollyXT (Jan 17th, 2016)
- CIMEL (Jan 17th, 2016)
- FLEXPART Retroplumes (Jan 17th, 2016)
- NMME-DREAM (Jan 17th, 2016)
- FLEXPART smoke forecast (Jan 17th, 2016)
- PollyXT (Jan 16th, 2016)
- PollyXT Overview (Jan 16th, 2016)
- NMME-DREAM (Jan 16th, 2016)
- FLEXPART Retroplumes (Jan 16th, 2016)
- FLEXPART smoke forecast (Jan 16th, 2016)
The campaign is organized and funded through the ACTRIS, the European Research Infrastructure for the observation of Aerosol, Clouds, and Trace gases.